Most “try ML in your browser” demos are a thin UI over an API: your CSV is uploaded somewhere, a server does the work, and you trust whatever comes back. LabML is the opposite bet: a complete machine learning platform - data auditing, training, evaluation, explanation, and model reuse - where every single computation runs on your own machine. No backend, no accounts, no uploads. Open the network tab while it trains eight models: nothing leaves.
It is live at app.dominicdapice.com, installable as an offline PWA, bilingual (EN/FR), and organized in three sections.
The ML Lab - /ml
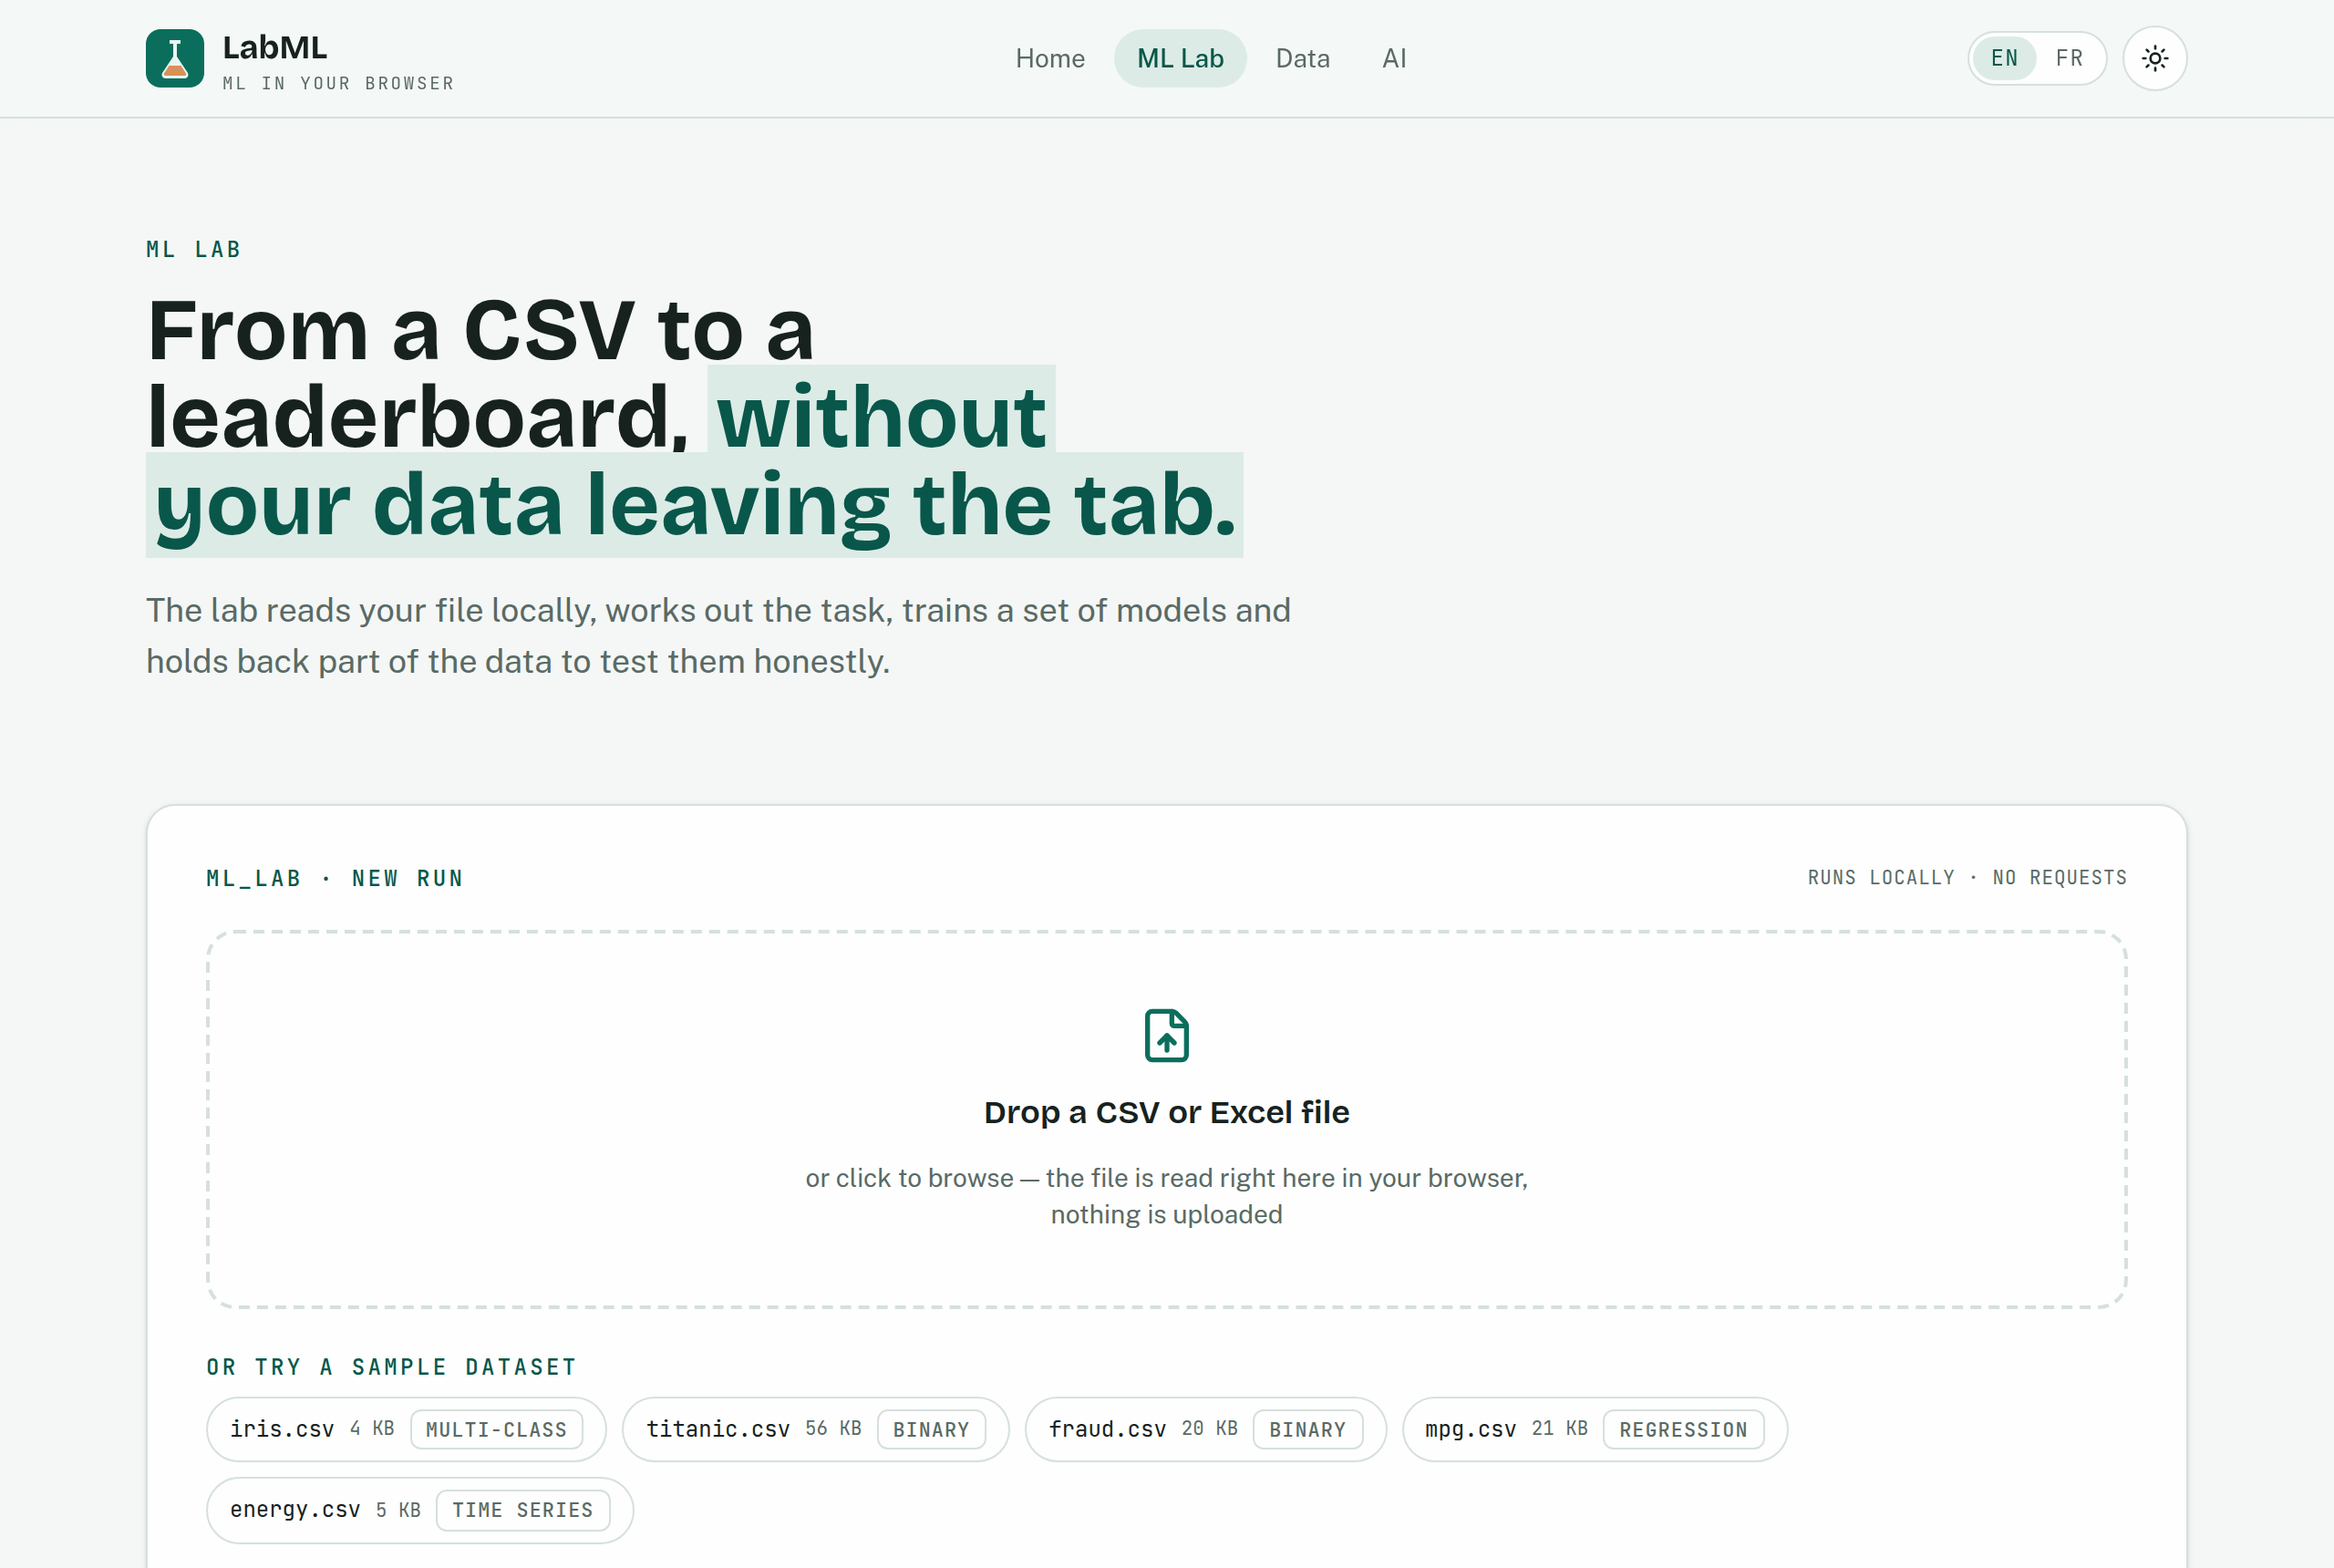
The core loop: drop a CSV (or Excel file, or pick a demo like titanic), choose the column to predict, and the lab profiles every column, detects the task (binary, multi-class, regression), flags identifiers, constants and target leakage, then trains a zoo of models in a Web Worker: naive baseline, linear/logistic regression, k-NN, Gaussian Naive Bayes, decision tree, random forest - plus a hand-written histogram gradient boosting (LightGBM-style quantile bins, second-order gains, Newton leaves) and a hand-written MLP (seeded He init, full-batch Adam).
Rather than describe it, here is the whole loop running, unedited:
Thirty-seven seconds, no cuts: titanic.csv dropped, survived picked, the alive column caught as target leakage and excluded on its own, eight model families and an ensemble trained in the browser, then the leaderboard, the per-segment failure analysis and the explanations. Nothing is uploaded — open the network tab and watch it stay quiet.
The leaderboard is only the beginning. What I really wanted to build is the part most demos skip: honest evaluation.
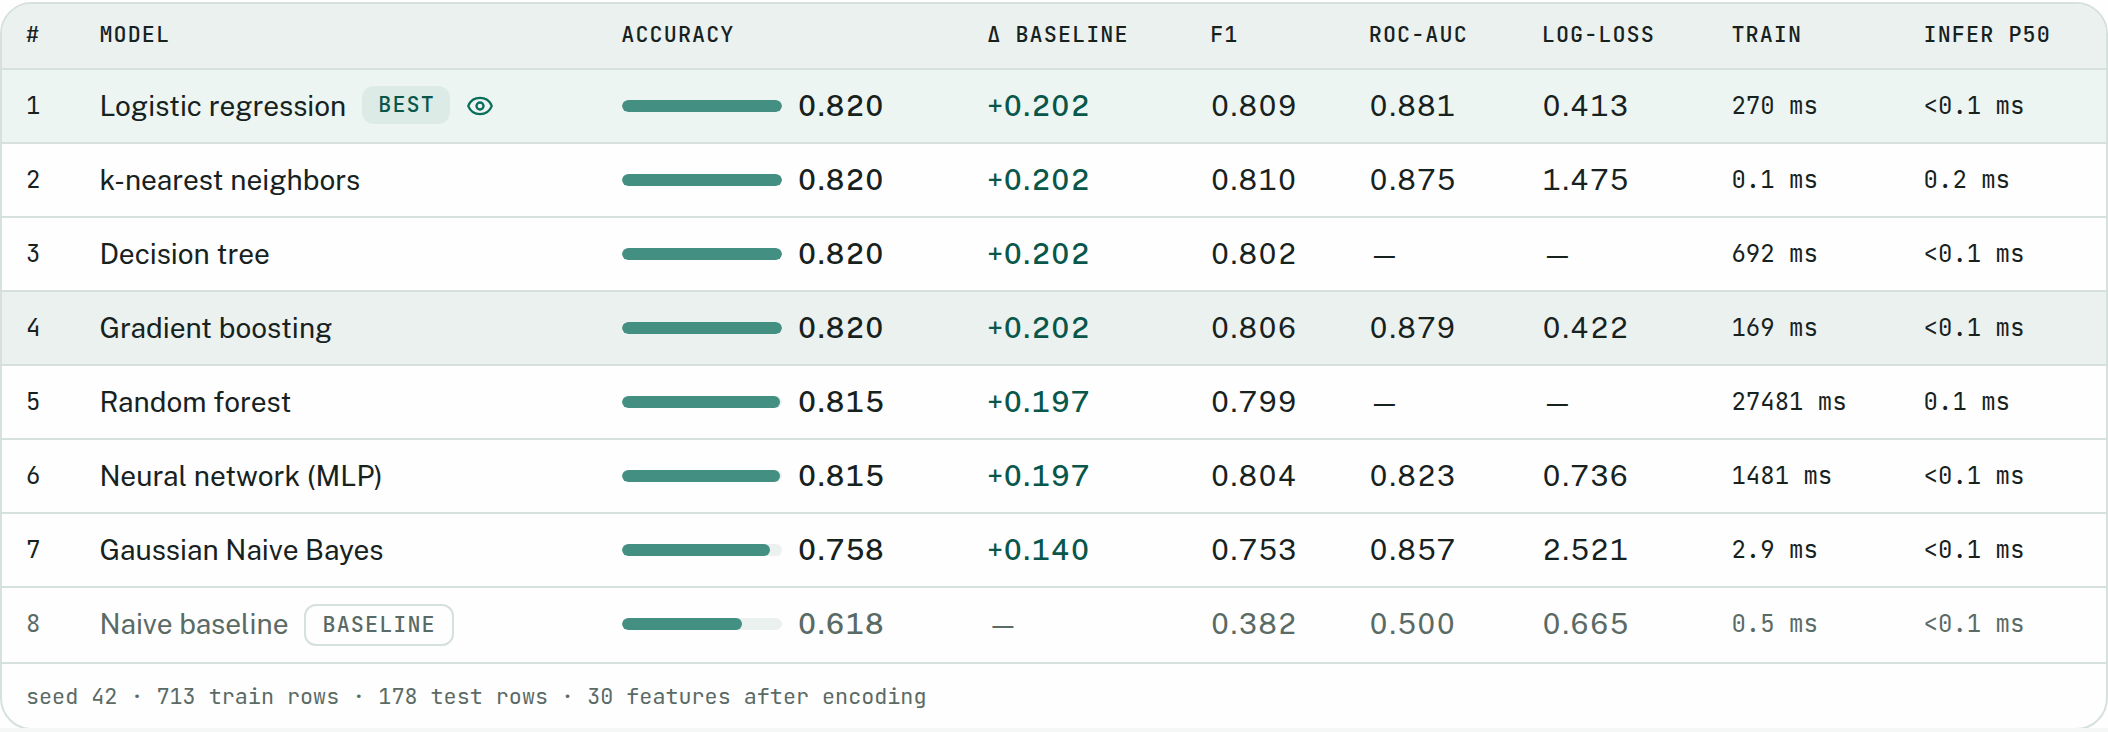
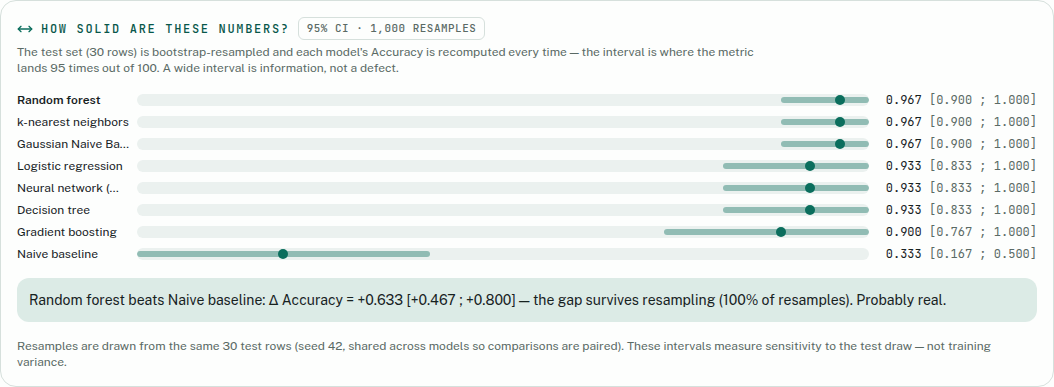
- Every run is scored against a naive baseline on a held-out test split (seeded, stratified - the same seed always reproduces the same run).
- Every leaderboard metric carries a 95% bootstrap interval (1,000 seeded resamples, shared across models so comparisons are paired), with a verdict that says whether the winner’s lead is “probably real” or “possibly noise”.
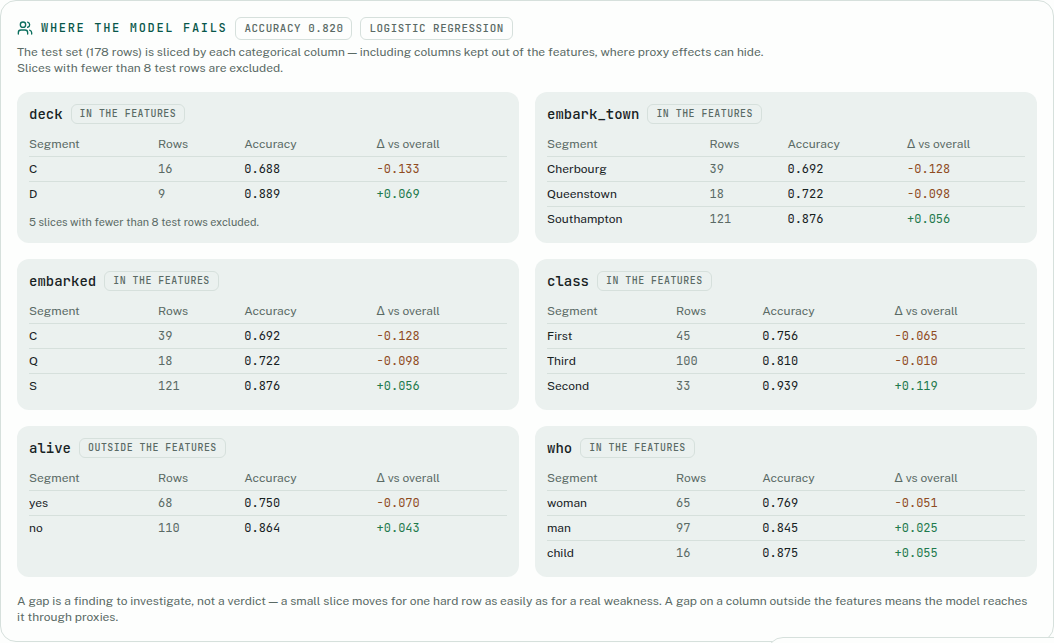
- A per-segment analysis answers “where does my model fail?” by re-scoring the test set on every categorical slice - including columns excluded from training, exactly where proxy effects hide. On titanic it points straight at deck C and Cherbourg passengers.
- On imbalanced data, a precision-recall curve, a calibration curve and a cost-priced decision threshold show what accuracy hides - a probability is not a decision; the threshold belongs to your costs.
Understanding tools round it out: permutation importance, partial dependence, live what-if predictions with exact Shapley explanations (the bars sum to prediction minus baseline), and a rule-generated plain-language read of every run - no LLM involved.
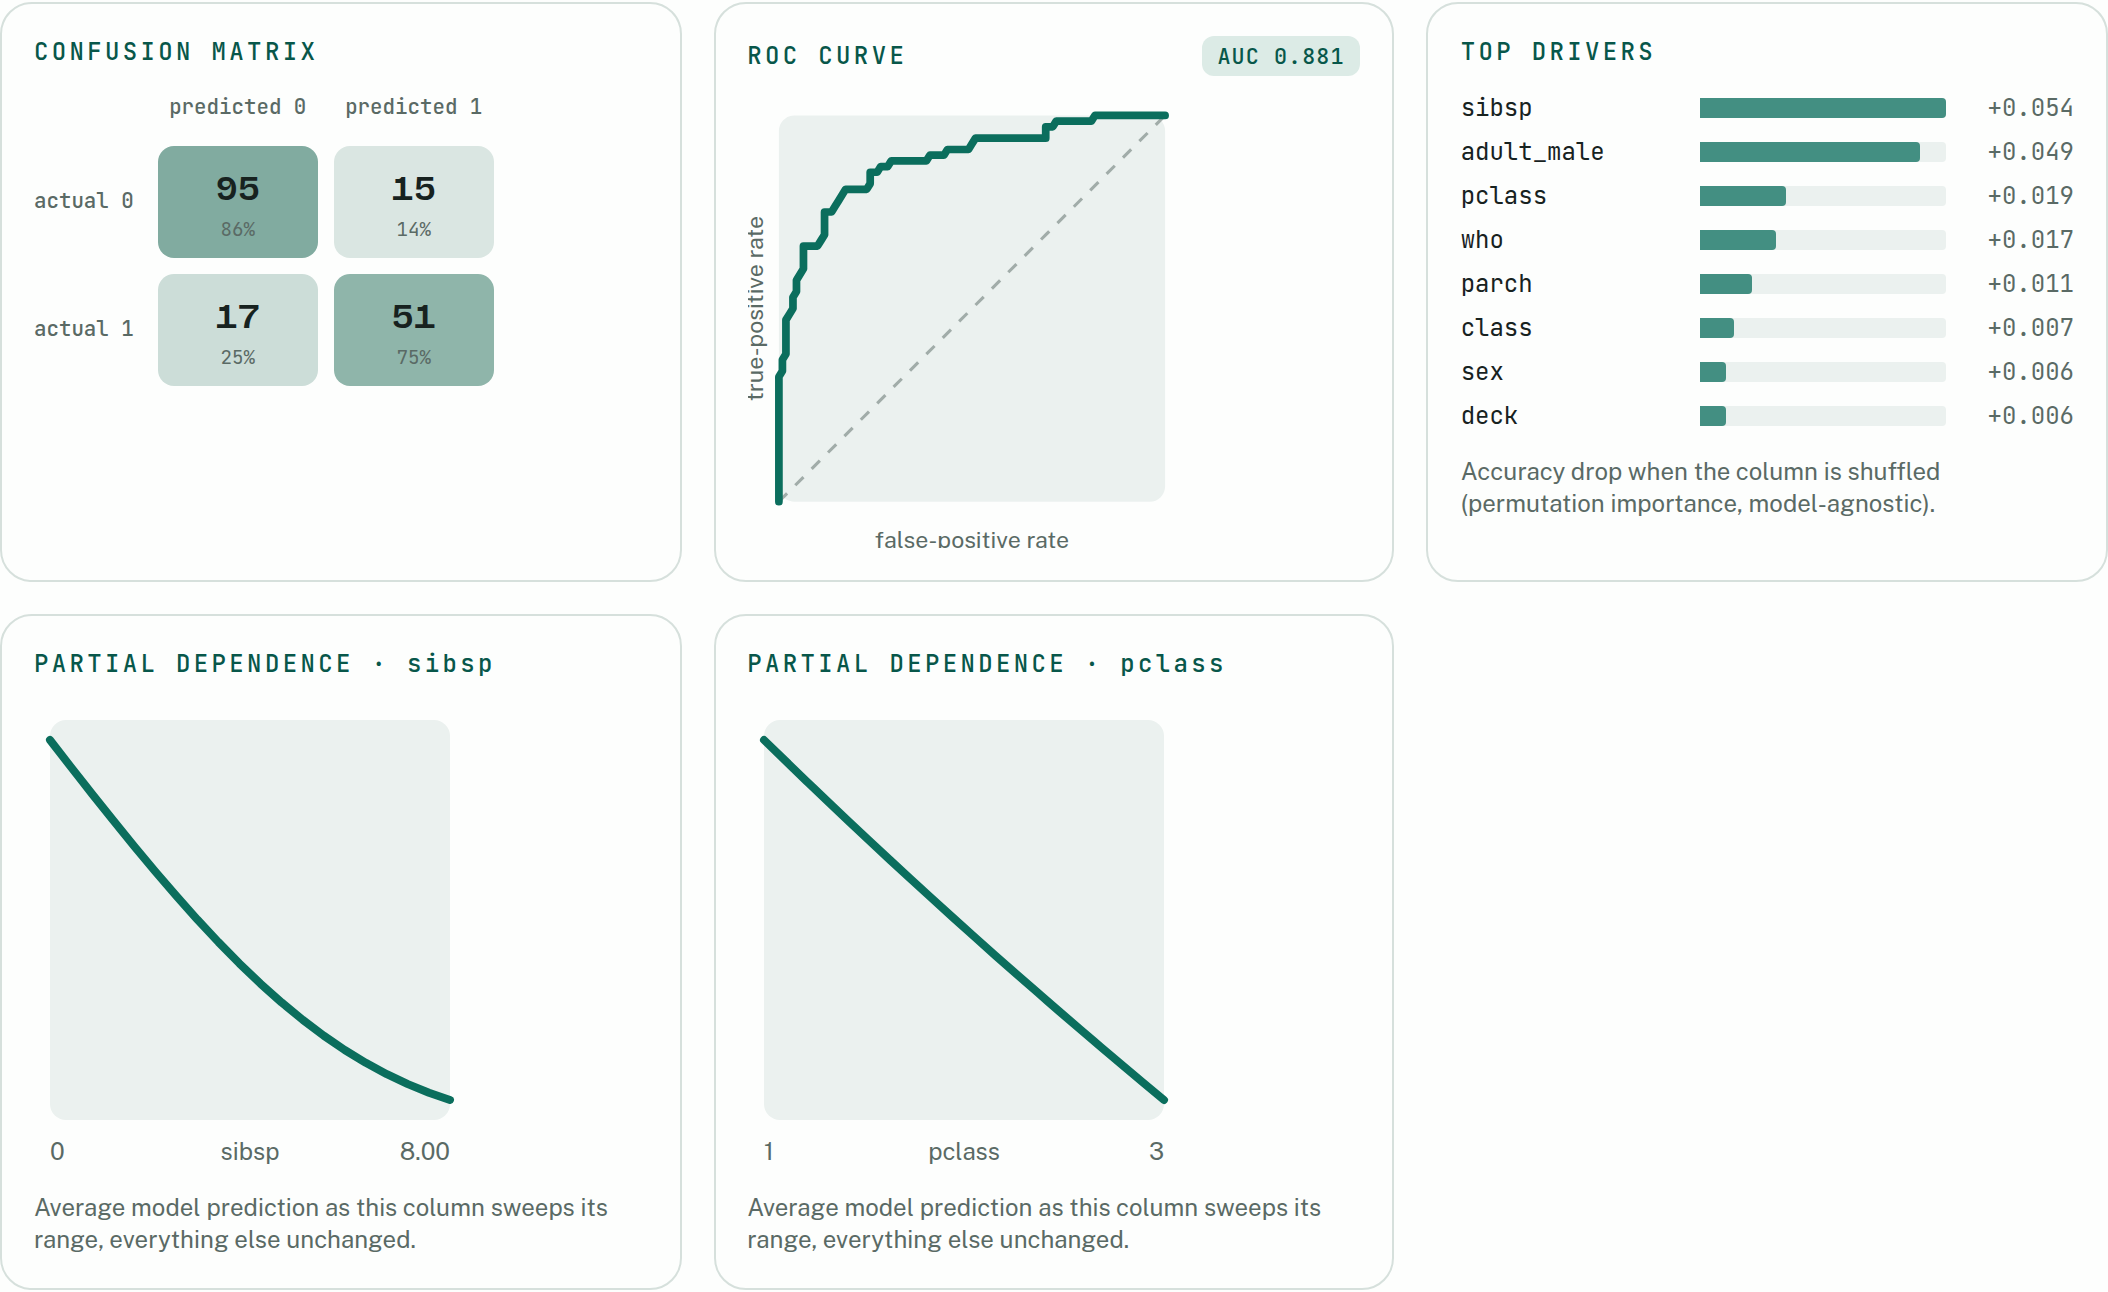
The lab also closes the loops a real workflow needs: score a new batch with an honest test-vs-batch comparison, compare two runs side by side (“did my cleaning help?” - with cross-run uncertainty verdicts), hyperparameter search by seeded random search with proper cross-validation, and export a model as JSON, then re-import it later - LabML rebuilds the exact predictor (byte-identical predictions) and scores any CSV without retraining. No target column? A seeded k-means + PCA exploration mode describes the groups it finds; a date column unlocks Holt-Winters forecasting validated by a rolling-origin backtest. Runs persist locally (IndexedDB) with all their artifacts, and a dataset can opt in to persistence under an explicit 50 MB budget.
Three later waves pushed it past demo scale. Free-text columns stopped being skipped: they enter the pipeline through a hand-written bilingual TF-IDF, fitted on the training split only, so the explanations speak in words - on the demo review file, fast and excellent push the prediction up, refund pulls it down. Scale was measured before it was engineered: a one-million-row file trains the whole zoo in about 130 seconds, and past 100,000 usable rows a seeded, stratified sample takes over - announced on the leaderboard, never silent, with every capped model still scored on the same full test set. And a learning curve answers the classic budget question - “would more data help this model?” - by retraining it on growing seeded fractions of the training split, with a confidence band and a plain-language verdict: still climbing, or flattened - work on features instead.
The Data Studio - /data
Real datasets are messy, so the lab has a dedicated repair shop. The Data Studio audits a file without uploading it - missing cells, duplicates, case/whitespace variants, Tukey-fence outliers, constant and id columns, rolled into a deterministic 0-100 score - and fixes it through a replayable cleaning recipe: trim, merge variants, deduplicate, impute, clamp outliers, force column types, expand dates, and drop multivariate anomalies found by a hand-written, seeded isolation forest. The recipe exports as JSON and replays on next month’s file.
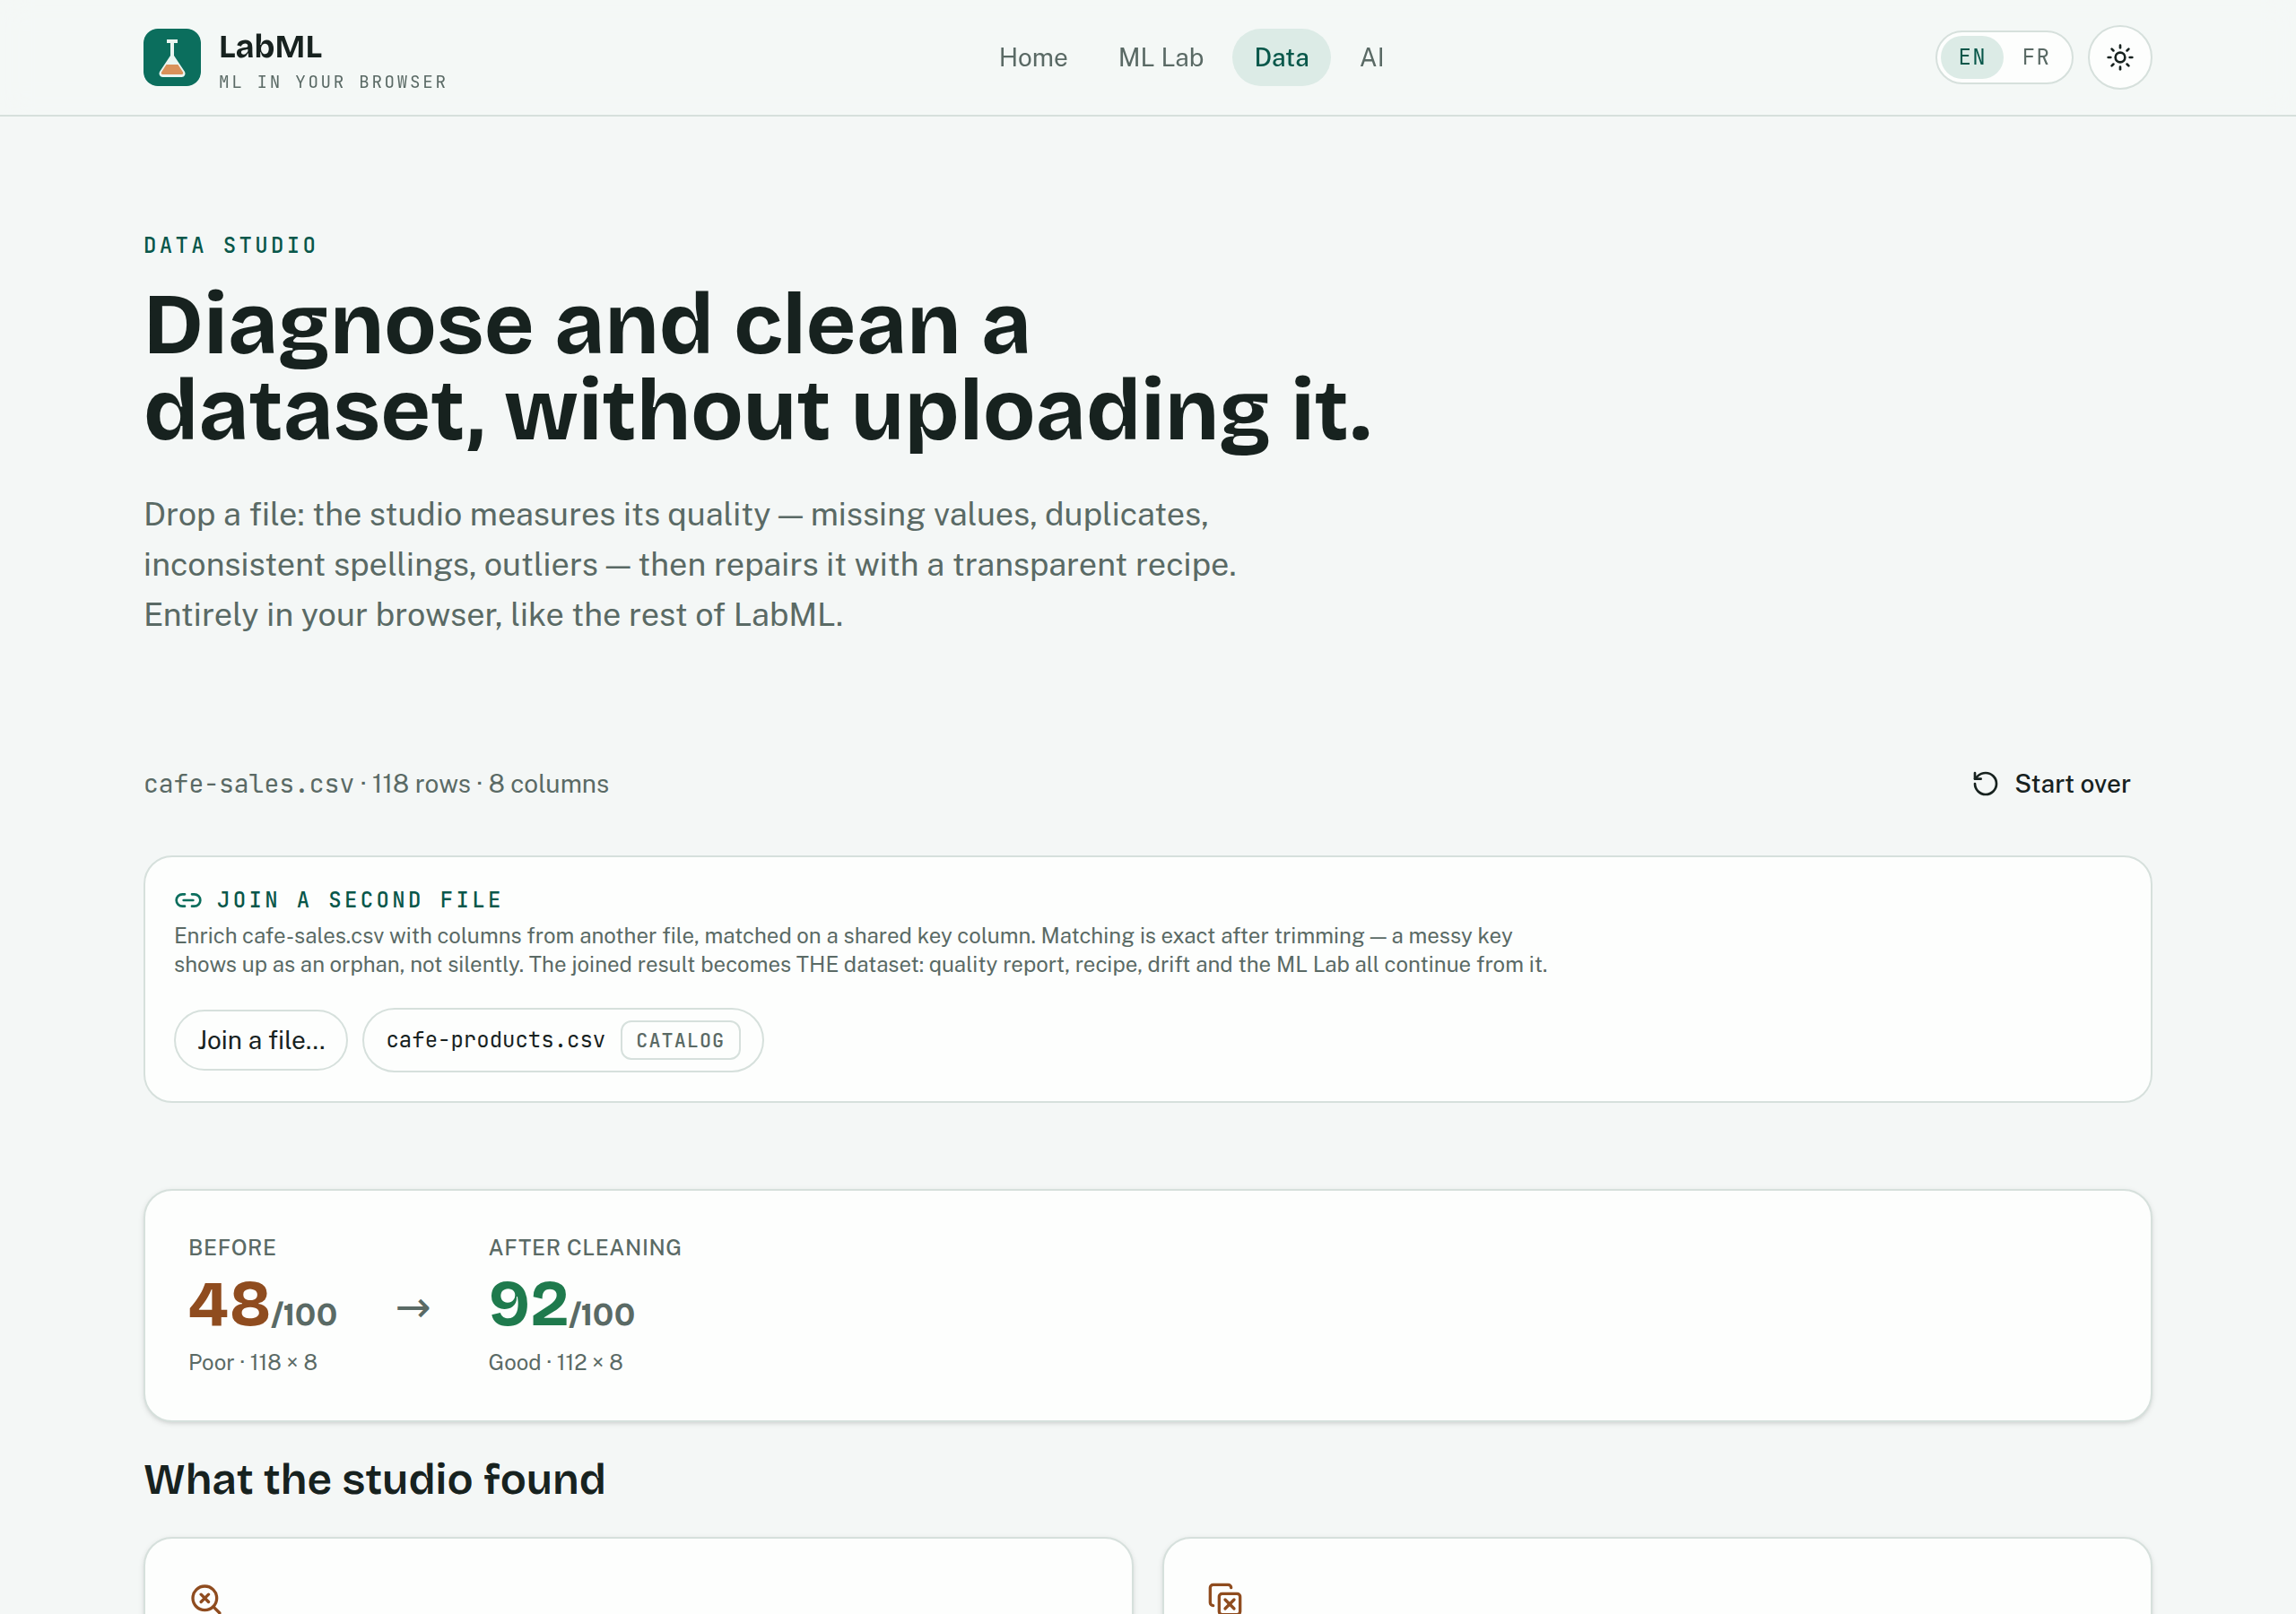
It also covers the two everyday data gestures most tools skip: left-joining a second file on a shared key (match rate, duplicates and orphans are named, never silent) and a drift check that compares a new batch against the reference - schema diff, PSI per column, new and vanished categories, severity verdict. One click hands the cleaned result to the ML Lab.
The studio also carries a real analytical engine now: SQL in the browser, through DuckDB compiled to WebAssembly - joins, window functions, aggregations over the file you just dropped, plus any extra CSV, Parquet or JSON file attached in the same session, each exposed as a view named after the file. The file is queried as dropped, before the cleaning recipe, so every result stays traceable to a file you can reopen; a result exports to CSV or moves to the ML Lab in one click, and SQL errors show DuckDB’s own message, which names the line and the token. No server involved - the engine itself is self-hosted and runs inside the tab.
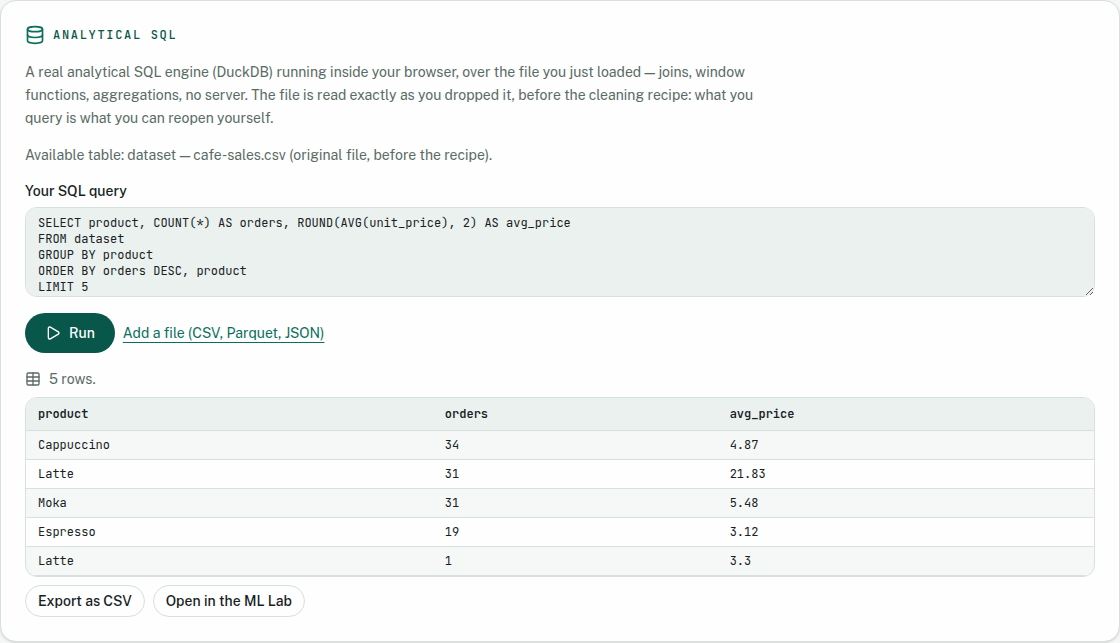
GROUP BY, answered by DuckDB inside the tab. The file is queried as dropped, before the cleaning recipe — which is why both spellings of Latte are still there, and why the average one of them carries is the outlier the studio flagged.The AI Playground - /ai
Two smaller experiments in on-device AI, same privacy rules:
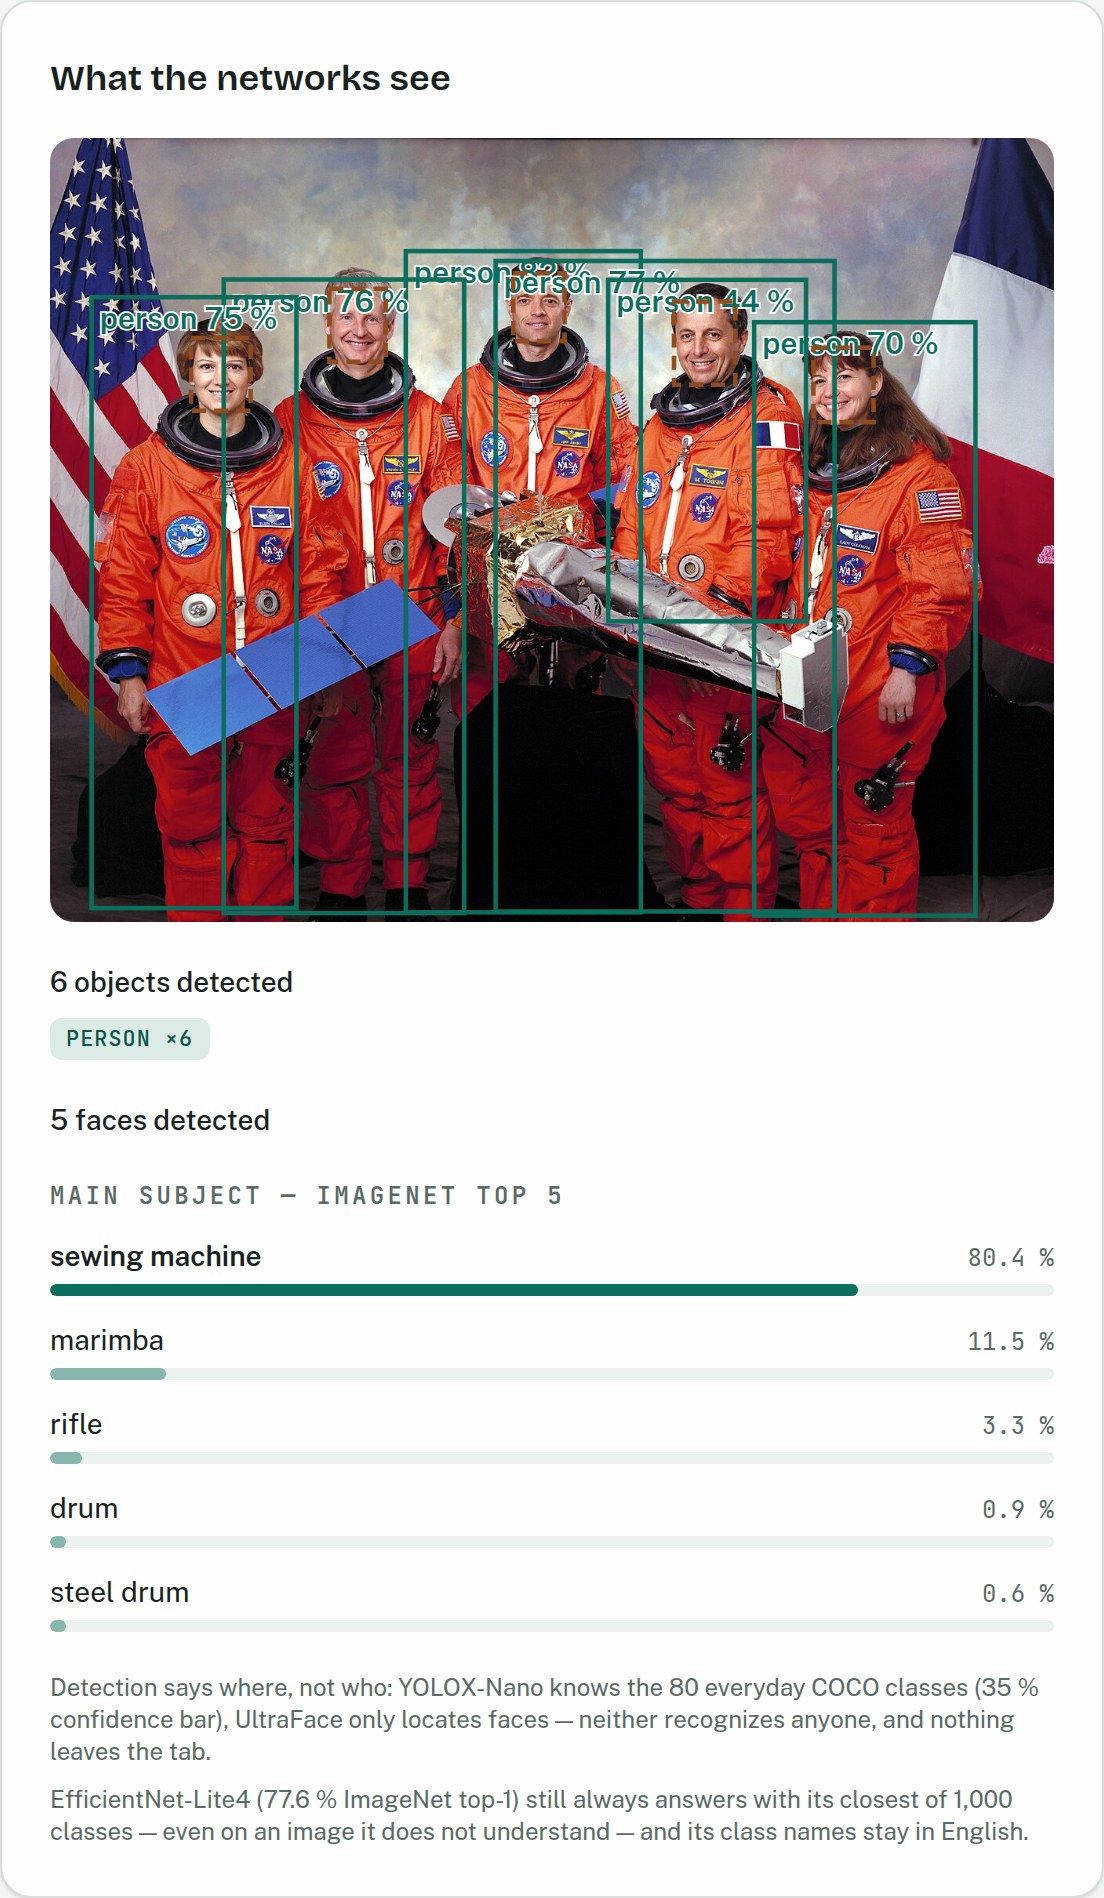
- Vision: image analysis running locally through ONNX Runtime Web (WebAssembly) - drop a photo or use the webcam and three self-hosted networks read it: an EfficientNet-Lite4 classifier names the main subject (1,000 ImageNet classes, 77.6% top-1), YOLOX-Nano draws boxes around the objects it finds (80 everyday classes) and UltraFace locates faces - “1 face detected”, counted in plain language. The box math (grid decode, IoU, non-maximum suppression) is hand-written and unit-tested, and the UI still says honestly what the models cannot know: detection says where, not who.
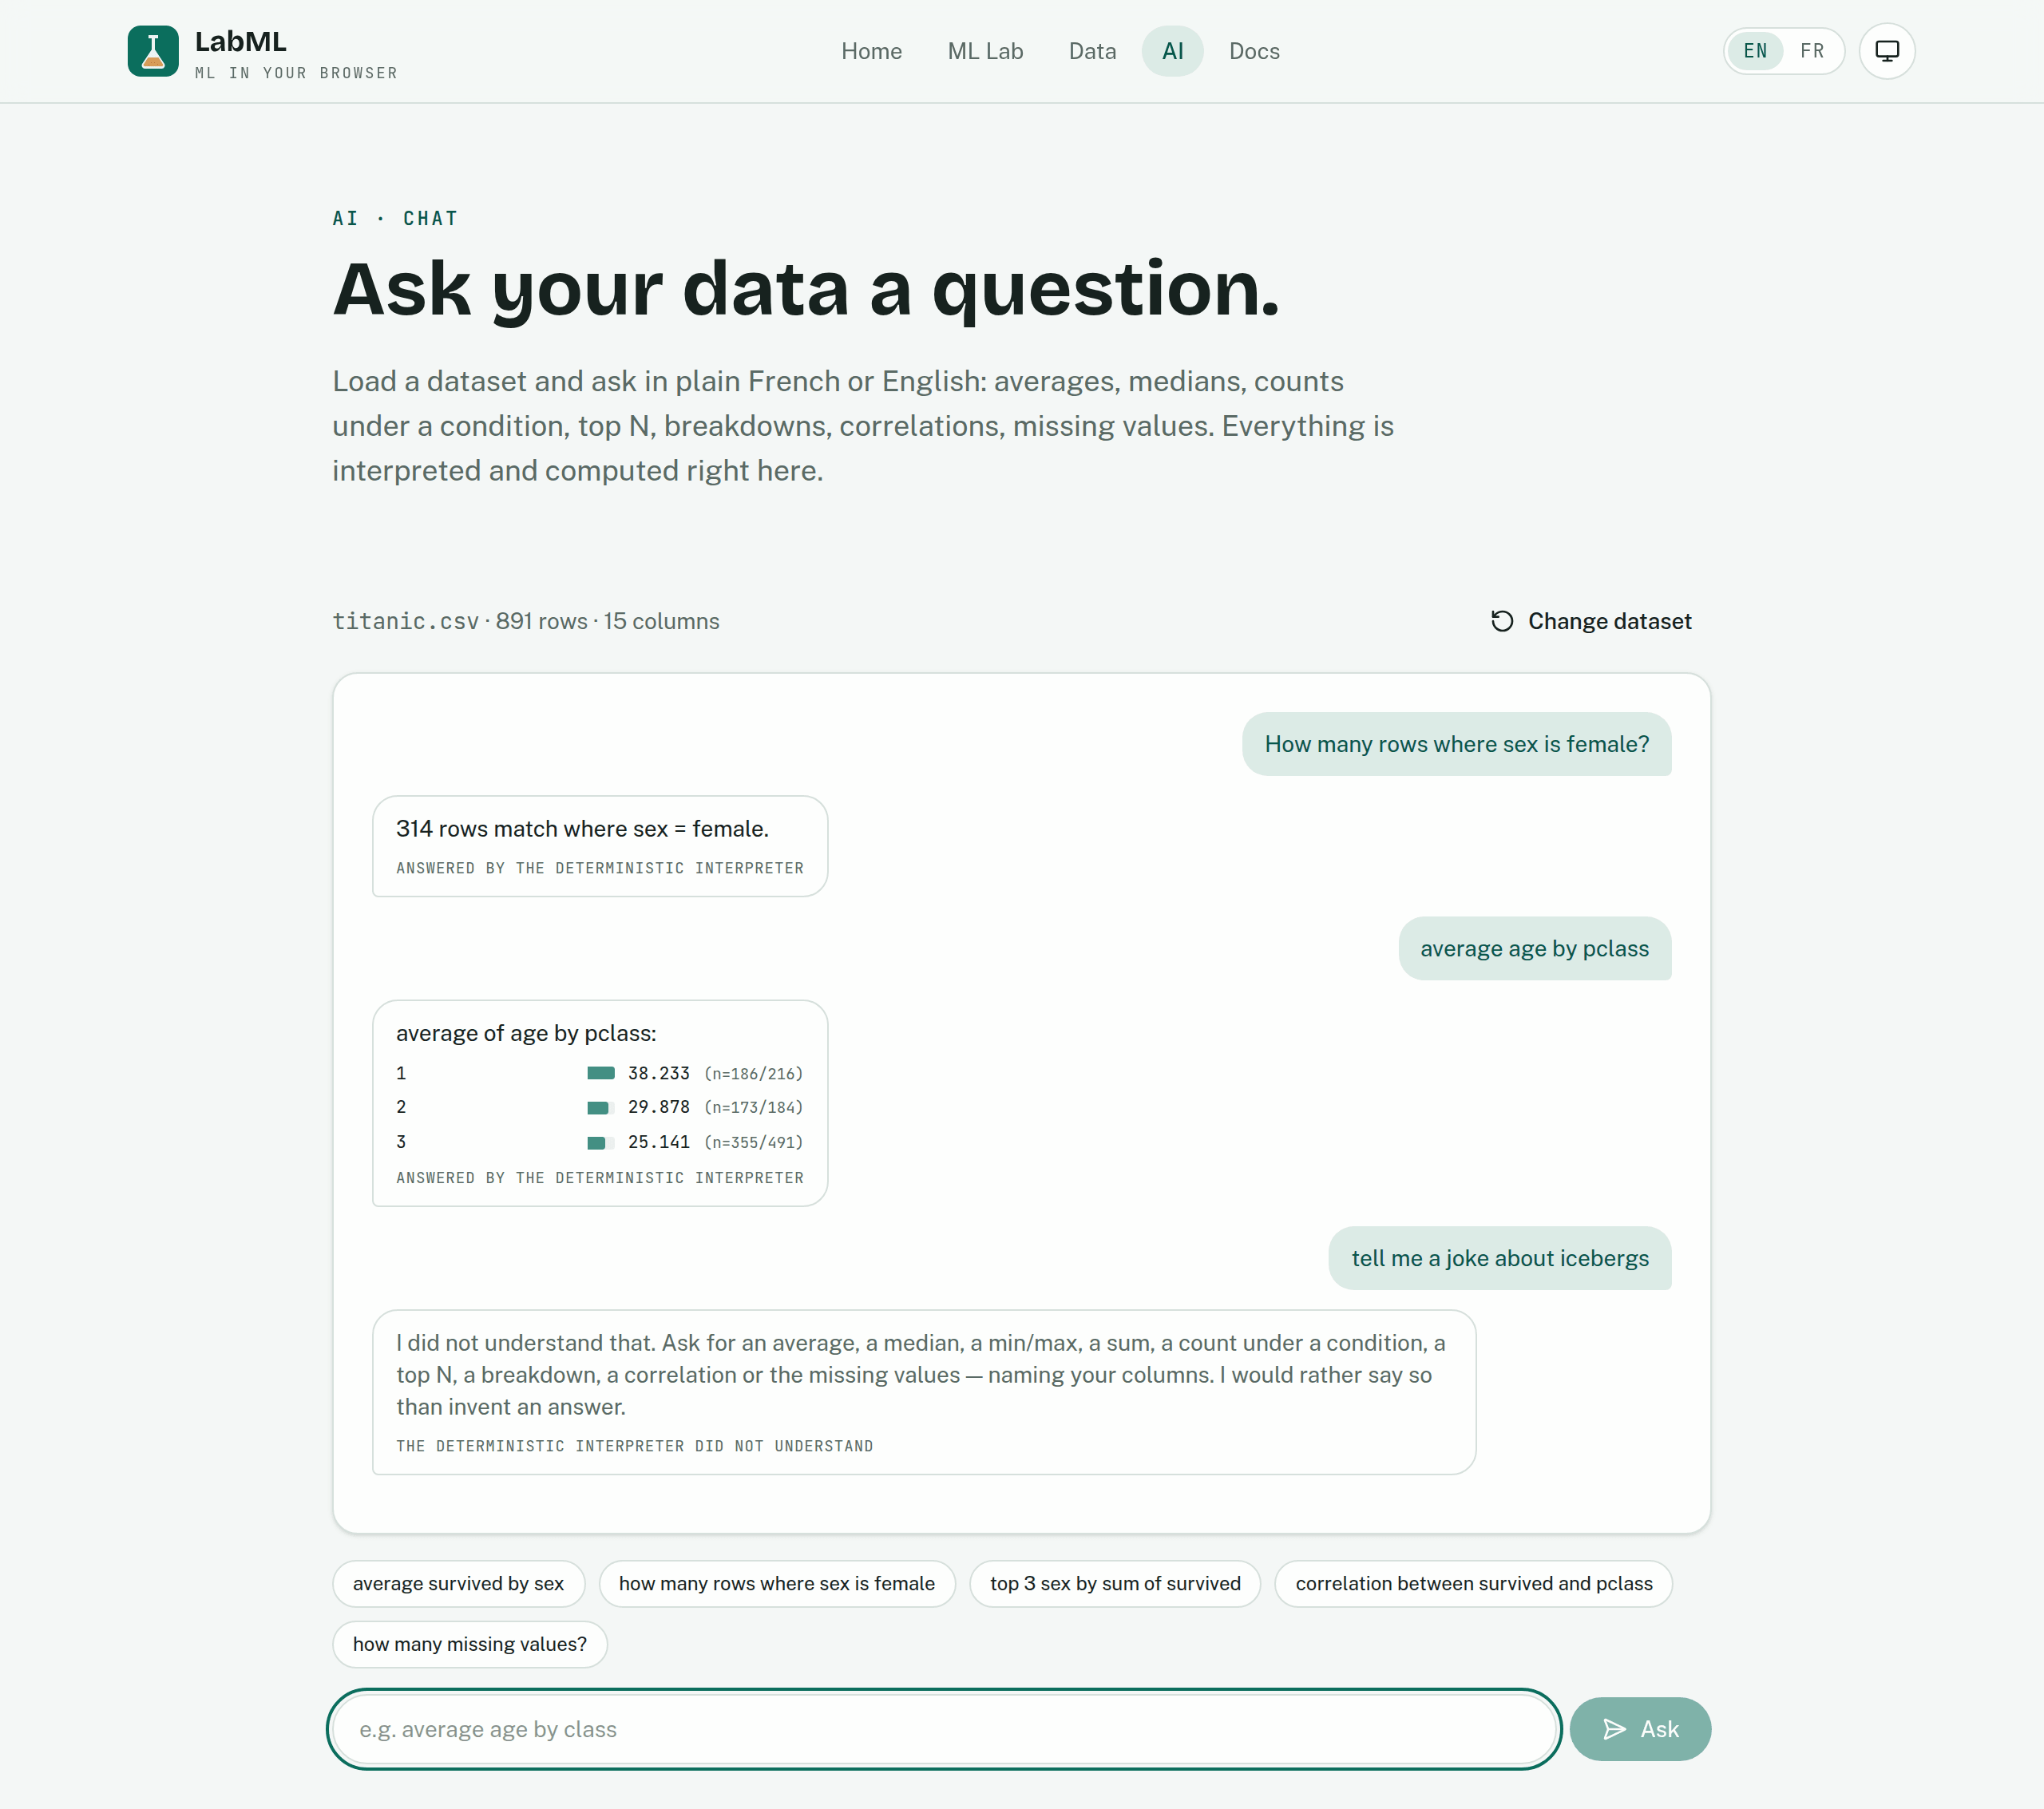
- Data assistant: ask plain English or French questions about your loaded dataset - averages, counts under a condition, top-N, correlations. A deterministic local interpreter reads every question first: it can only name a column that exists and a value that actually occurs in it, and when it does not understand, it says so instead of guessing. On explicit consent, a real language model - Qwen3-0.6B, 355 MB, Apache-2.0, self-hosted, running locally on WebGPU - steps in as a rescue for the phrasings the interpreter gives up on. It never computes: it only translates the question into a closed query grammar, the deterministic engine produces every number, and a badge under each answer names which engine did the reading. Measured on six reference questions over titanic, the pair now answers five - and the sixth failure is recorded in the plan as a limit of a 0.6B model, not papered over.
Under the hood
The engineering constraint that shaped everything: if it computes, it was written by hand and it is deterministic. Gradient boosting, MLP, k-means++, power-iteration PCA, Holt-Winters, isolation forest, PSI, Shapley values, bootstrap intervals, PR/ROC and calibration curves, detection box decoding (grids, IoU, non-maximum suppression) - all implemented from scratch in TypeScript, seeded end to end, and unit-tested against known results. Everything heavy runs in Web Workers behind typed message protocols, so the UI never blocks.
Some constraints came from the host rather than the math. The deploy target refuses any single file over 25 MiB - so the 355 MB language model is fetched at deploy time and split into 24 MiB parts the browser glues back together, every part checked against pinned byte sizes (a mismatch fails the build, never the visitor), and DuckDB is pinned to the last version whose WebAssembly still fits under the limit. Measured, and written down in the plan, so the next upgrade re-measures instead of rediscovering.
The quality bar is enforced in CI: 352 unit tests, 61 Playwright end-to-end tests
(including an offline-PWA test, a fake-webcam test and axe-core WCAG accessibility
checks), strict TypeScript, and Lighthouse budgets - the /ml page scores ≈ 0.99 on
mobile under real throttling thanks to prerendered static shells that paint before
JavaScript arrives.
And the privacy claim is architectural, not a promise: a strict Content-Security-Policy allows zero third-party calls, share links carry metrics in the URL fragment (which browsers never send to servers), and the whole app - demo datasets and vision models included - keeps working with the network cable pulled. A dedicated /privacy page goes one step further and hands the reader a four-step DevTools protocol to verify all of it without trusting a word of it - and the policy it quotes is pinned to the actually-served header by a unit test, so the page cannot claim a protection the site quietly dropped.
Try it: app.dominicdapice.com - load the titanic demo, train, and scroll: the leaderboard, the intervals, the segment analysis and the threshold tools tell one honest story about a model in about thirty seconds.
Source code: github.com/dapiced/LabML
Comments
Sign in with your GitHub account to leave a comment or a reaction.